|
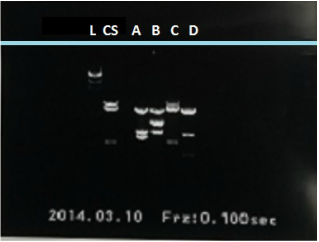
Figure 5. The 1% agarose gel used with RFLP analysis of crime scene and suspect's DNA. The L represents the well where the ladder, HindIII lambda phage digest DNA was loaded. CS is the crime scene data, A through D represents the suspects A through D. Where suspect A is Chalemange, suspect B is Vanellope, suspect C is Le'Monjello and suspect D is Kyndle. The blue line represent the wells which is the point that the bands were measured from. The bands can be represented by the number of base pairs present and therefore shorter DNA fragments will be displayed further down the gel.
|
|
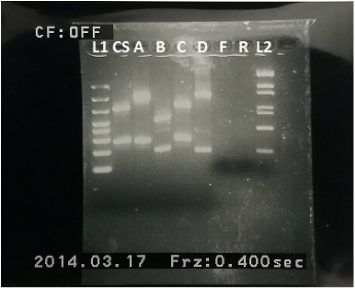
Figure 6. The 3% agarose gel that was used with STR and VNTR analysis. L1 is the TH01 allele ladder, CS is the crime scene data, A through D represents the suspects A through D. Where suspect A is Chalemange, suspect B is Vanellope, suspect C is Le'Monjello and suspect D is Kyndle. F was investigator Ashley Fuhrmann, R was investigator Meaghan Ross, and L2 is the 200 bp ladder. CS through D were STR analysis and F through R were VNTR analysis. The bands can be represented by the number of base pairs present and therefore shorter DNA fragments will be displayed further down the gel.
.
|
|
